

Vibration condition monitoring fundamentals – Vibration Metrics
Vibration Metrics
In condition monitoring, vibration analysis is crucial for checking the health of machinery. Typically, a single vibration measurement is converted into a frequency spectrum using the Fast Fourier Transform (FFT) for detailed analysis. However, plotting or trending multiple measurements creates a complex 3D surface, making it hard to observe and set monitoring thresholds.
To simplify this, experts have developed ways to convert a full vibration measurement into a single value. This makes it easier to visualize trends and set thresholds. Examples of these vibration metrics include Root Mean Square (RMS), peak-to-peak values, and kurtosis. Each metric captures different aspects of the vibration data, helping to provide a clear picture of the machinery’s condition.
In this article, we review some of the most important vibration metrics.
Different metrics
Let us assume the following is a single vibration measurement. Several important functions such as
min, max, and mean, and RMS are visualized on the measurement.
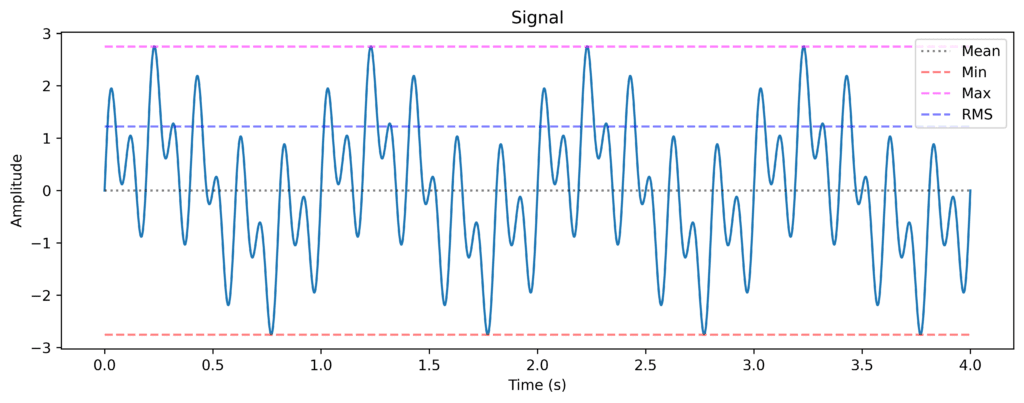
Figure 1: Time signal with Mean, Max, Min, and RMS marked out
Peak-to-peak
Peak-to-peak measurement in vibration analysis refers to the difference between a vibration signal’s maximum positive and maximum negative amplitudes. This measure indicates the total range of vibration displacement, helping to identify the extremes of machine movement and potential impacts that could indicate issues such as imbalance or misalignment.
Peak
Peak (0 to peak) measurement in vibration analysis refers to the maximum absolute value of the vibration signal from its baseline (zero). It captures the highest single amplitude of the vibration, indicating the most significant deviation from the normal state. People use peak measurement because it can quickly highlight the most extreme vibration level, which is crucial for detecting sudden or severe changes in machinery conditions that might not be evident in the peak-to-peak measurement. Peak measurement is simpler and provides immediate insight into potential issues like impacts or sudden loads.
RMS (root mean square)
RMS is a statistical measure of the magnitude of a varying quantity. In vibration analysis, it reflects the overall level of vibration energy, providing an average value that helps assess the intensity of the vibrations. This makes RMS useful for detecting changes in machine health and performance.
RMS is calculated by:
![\[ $\sqrt{\frac{1}{N}\sum_{i=0}^N y_i^2}$ \]](http://3.77.223.181/wp-content/ql-cache/quicklatex.com-1b740c766819207c18a32d0003636b01_l3.png "Rendered by QuickLaTeX.com")
There are also two dimensionless measures of how peaky the signal is, crest factor and kurtosis.
Kurtosis
Kurtosis is a statistical measure that indicates the “tailedness” or sharpness of the peak of a vibration signal’s amplitude distribution. In vibration analysis, high kurtosis values suggest the presence of infrequent but extreme deviations, often indicative of impulsive events such as impacts, shocks, or faults. People use kurtosis because it is sensitive to these extreme events and can detect anomalies or irregularities in machinery that other metrics like RMS or peak values might miss. This makes kurtosis valuable for identifying early signs of mechanical defects.
Kurtosis is calculated by:
![\[ \frac{1}{N}{}\sum_{i=0}^N\left(\frac{y_i-\mu}{\sigma}\right)^4 \]](http://3.77.223.181/wp-content/ql-cache/quicklatex.com-c242178beb8f56b87193e7fea3b8b0e7_l3.png "Rendered by QuickLaTeX.com")
where  is the mean and
  is the standard deviation of the data.
Crest Factor
The crest factor is the ratio of the peak value of a vibration signal to its RMS value. Vibration analysis helps identify the presence of spikes or transient events in the vibration signal. A high crest factor indicates that the vibration signal has sharp peaks or impacts relative to its overall energy level. People use the crest factor because it can highlight intermittent faults or abnormalities in machinery, such as gear tooth defects or bearing issues, that might not be apparent from RMS or peak measurements alone.
Let us look at two examples of how Kurtosis and Crest Factor capture the “spikyness” of the signal.
In Figure 2, we have a sum of a few sinusoidal waves lacking spikyness. Therefore it gives a relatively low kurtosis and crest factor. The kurtosis for a pure sinusoid wave is 1.5 and the kurtosis for a pure noise is 3. The crest factor for the pure sinusoid is 1.4 but the crest factor does not have a value for pure noise.
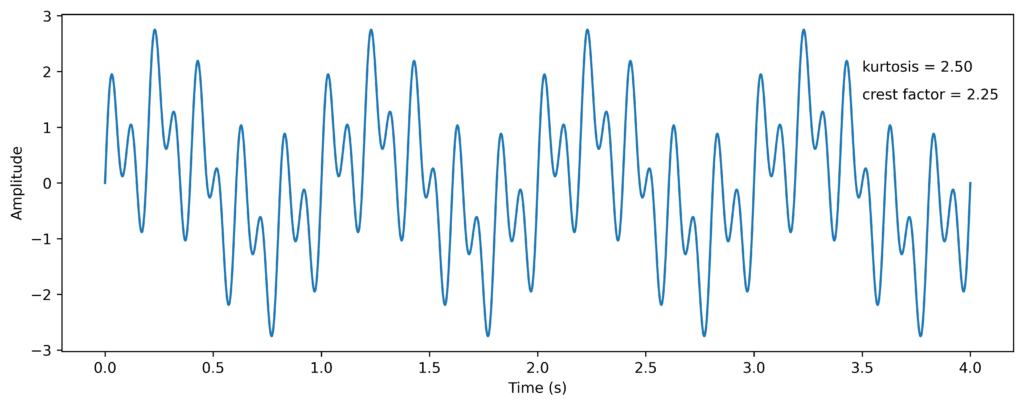
Figure 2: Harmonic time signal with the kurtosis and crest factor values.
Here we have the same signal with a burst of energy in the middle. We see that the values for both crest factor and kurtosis increase indicating the signal is less harmonic and has an uneven behavior.
The crest factor is calculated by peak-to-peak/RMS.
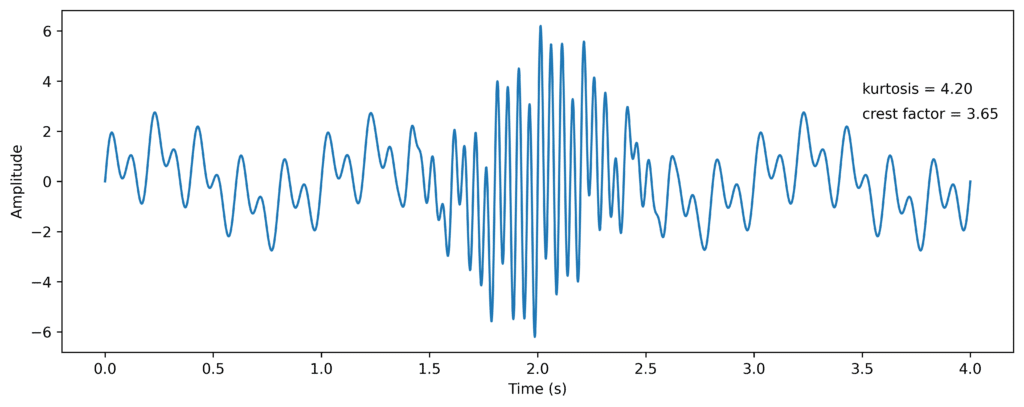
Figure 3: Harmonic time signal with a burst of energy in the middle with the kurtosis and crest factor values.
Conclusions
Understanding and utilizing various vibration metrics is essential for effective condition monitoring of machinery. Converting vibration measurements into single values like RMS, peak, peak-to-peak, kurtosis, and crest factor allows for clearer visualization of trends and setting of thresholds. Each metric offers unique insights into different aspects of the vibration data, helping to detect potential issues early and maintain optimal machine performance. By leveraging these key performance indicators, maintenance professionals can ensure more accurate diagnostics and timely interventions, ultimately extending the lifespan and reliability of their equipment.

