

Vibrational condition monitoring fundamentals – Aliasing and the solution
Aliasing and the solution
In the last article, we reviewed one of the important fundamental topics in vibrational condition monitoring, vibration metrics. This week we are going to explain the limitations to what you can see in the spectrum, explain Ailiasing, and why some hardware designs have been made.
Aliasing and how sensors have solved it
How well we can capture a signal depends on how often we sample it. If we sample it more often we can capture it more accurately. However, a higher sample rate comes at a cost which we will discuss in our upcoming articles. The Nyquist theorem states that an analog signal can be digitized without distortion if and only if the sampling rate is greater than or equal to twice the highest frequency component in a given signal. So to be able to tell which frequencies compose a signal we need to sample it twice in each period. Half the sample rate is also known as the Nyquist frequency. The Nyquist theorem has a rigorous mathematical foundation but what is important for us to know is that to digitalize analog data fully and without corruption, one needs to sample it at least twice its highest frequency. The distortion caused by a sampling rate of less than half of the highest frequency of the signal is called Aliasing.
Let us look at a practical example; you see a signal with one 1 Hz oscillation and one 5 Hz oscillation combined. As the highest frequency component for the signal is 5 Hz, we want the Nyquist frequency to be 5 Hz. This means we must at least sample his signal at 10Hz to avoid distortion. Below is the original signal sampled at 30 Hz and less frequently sampled versions sampled at 15Hz and 7.5 Hz.
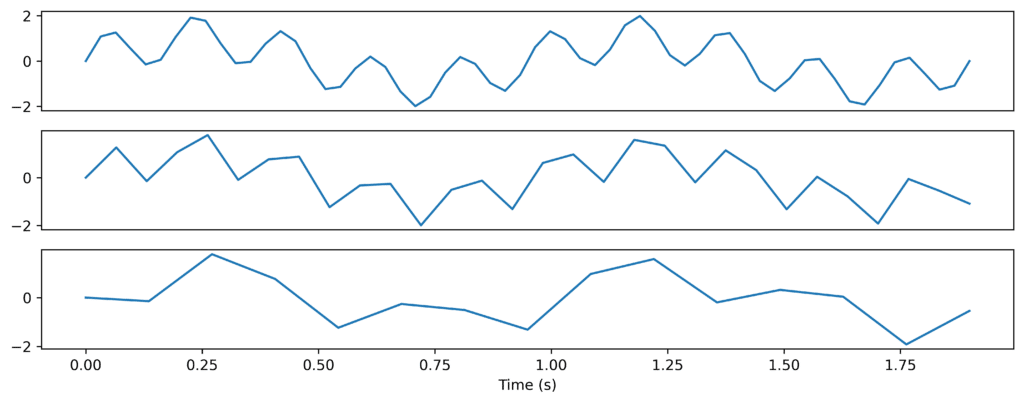
Figure 1: The same signal captured at three different sample rates.
We see that the original signal sampled at 30 Hz displays both frequency components clearly. In the second example, the sampling rate is 15 Hz yet both 1Hz and 5Hz components of the data are captured in the sampled data. In the third example, the sampling rate is reduced to 7.5 Hz which gives the Nyquist frequency to be less than 5 Hz. We can no longer reconstruct that original signal and the data has been distorted. This is because the signal is sampled just under twice per period. The spectrum of the third example is shown in Figure 2.
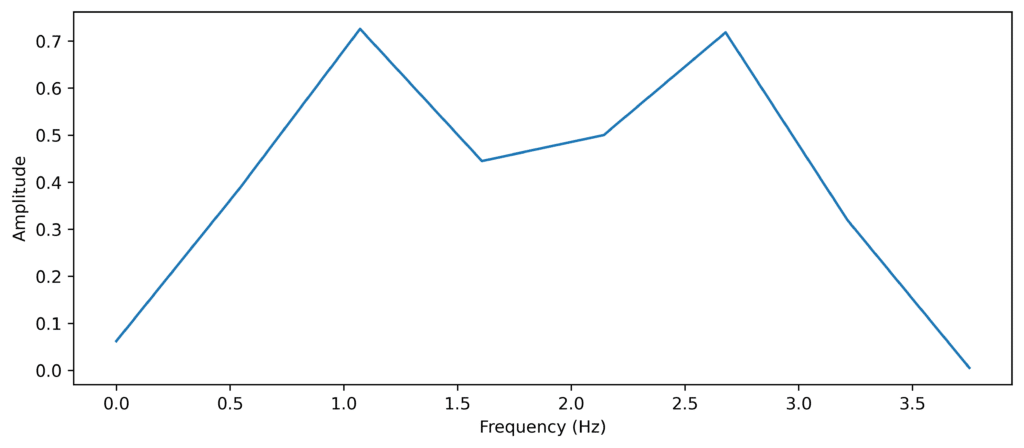
Figure 2: The spectrum of the signal captured with the lowest sample rate.
Figure 2 gives a false impression that we have a signal that has both 1 Hz components and 2.5 Hz components I.e. the 5 Hz component appears wrongly at 2.5 Hz. This is caused by Aliasing which is when parts of the signal have higher frequencies than the Nyquist frequency ending up distorting the sampled signal.
To solve this the vibration sensors have a Low Pass filter filtering out everything above the Nyquist frequency, reducing the problem of aliasing. This removes the parts of the signal that have frequencies higher than the Nyquist frequency just leaving the parts the sensor can capture. If we use a low pass filter that removes everything over 4 Hz on the signal above we get this.
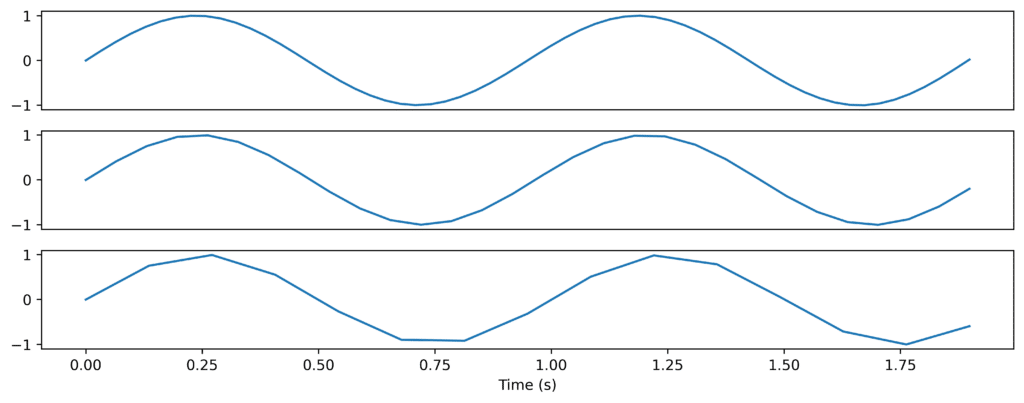
Figure 3: The signal after passing through a low pass filter in different sample rates.
Here we can still extract the same information from each figure even though it is sampled at different rates.
Conclusions
Aliasing and the Nyquist frequency are known and well-understood phenomena in signal processing. However, we will also feel their effects when we do vibration condition monitoring. It is therefore important to understand the concepts and the solutions that have been made to minimize these effects.

